

Obsidian Vault
Personal Branding, Research & Learning
Network theory, Knowledge Graphs and GNNs
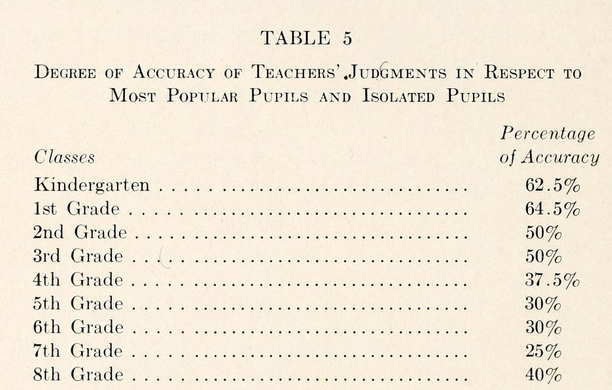
Sociograms
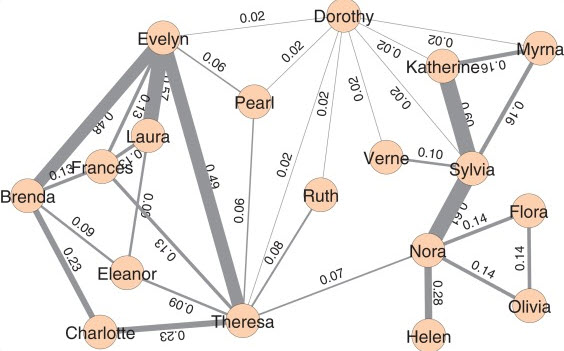
Davis Southern Women Network. This network records the co-attendance of 18 women in 14 social events over a 9 month period. Originally from: Davis, A., Gardner, B. B., Gardner, M. R., 1941. Deep South. University of Chicago Press, Chicago, IL. This image from Batagelj, 2022, Analysis of the Southern women network using fractional approach, Social Networks, 68.
Psychologist Jacob Moreno was the first to study social networks and construct visual representations called sociograms from them. In his book he makes sociograms for students of different grades in a primary school. The (directed) relation is who wants to be sitting next to whom and each child can choose two others.
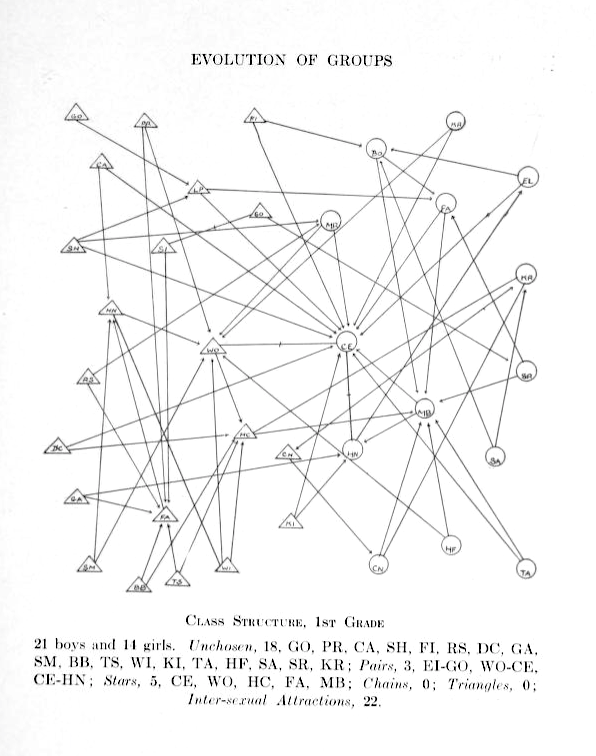
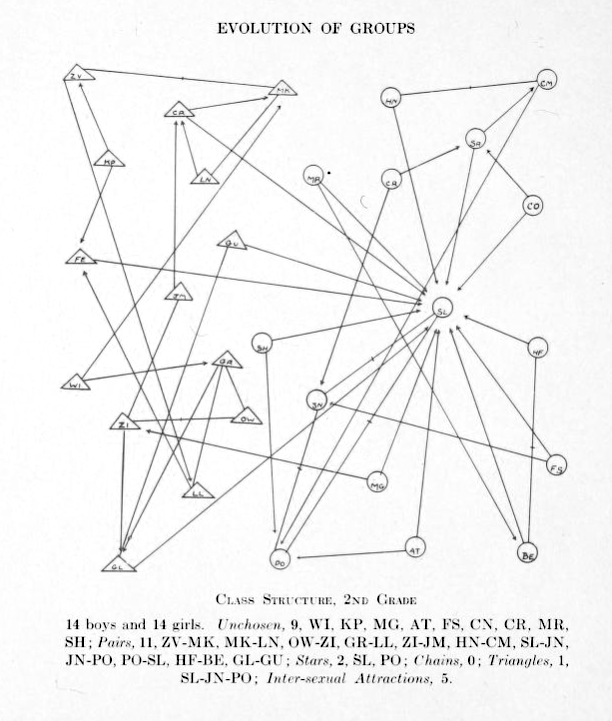
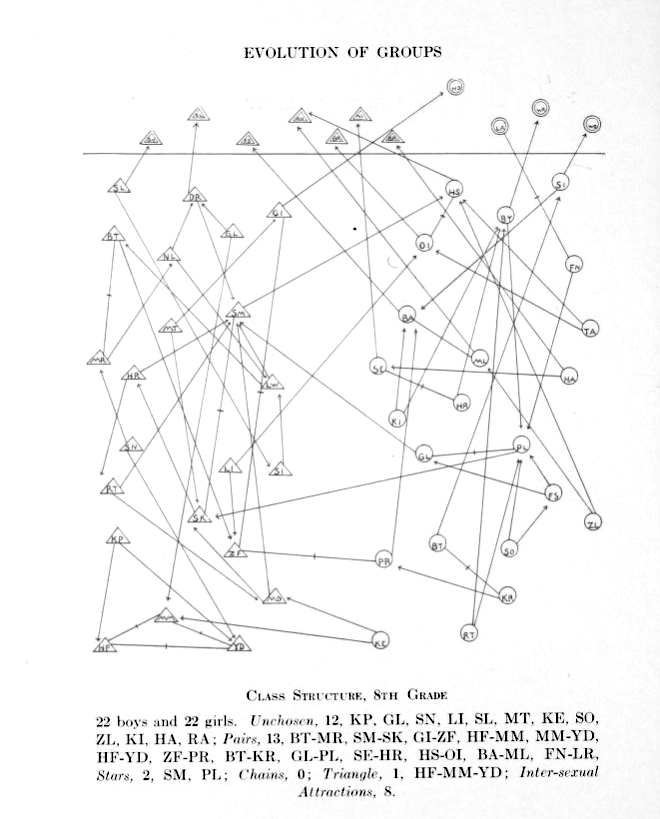
Girls are represented by circles while boys are drawn as triangles.
Source: Jacob Moreno, Who shall survive? A New Approach to the Problem of Human Interrelations, 1934
Dunbar number
Anthropologist Robin Dunbar realized a relation between the size of the neocortex of primates and the size of their social groups. He proposed that a person cannot handle more than about 150 stable relations at the same time.
Giant component
Even if a social network is not connected, it is likely that it has a very large connected component.
The giant component is a connected component that contains a “significant” fraction of all the nodes.
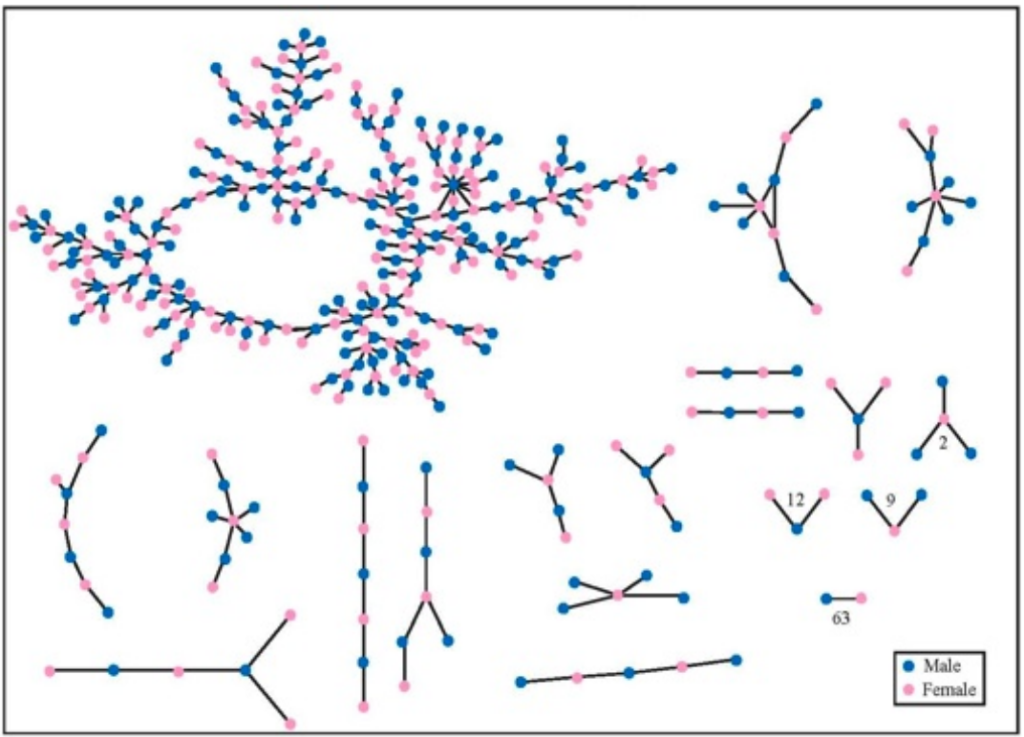
The network of romantic relationships, recorded over a 18 month period, in an American high school. Source: Peter Bearman, James Moody, and Katherine Stovel, American Journal of Sociology, 110(1):44–99, 2004.
Note that there are very few triangles in the network, which (as we will see) means that it has very small clustering coefficient.
If everybody knows an average of 150 people by first name, then we can expect the number of people connected to us to grow exponentially as the hop length (distance) increases.
Small world phenomenon
Not just large networks have giant connected components, they can have surprisingly short diameters.
For example if you have a friend living in a different part of the world, he/she connects you to a whole new network of people.
Stanley Milgram mailed 296 letters to randomly chosen addresses in northwestern United States. Recipients were asked to either:
- mail the letter to an address in Boston, if they knew the target recepient or,
- send it to someone they knew on the first name basis who was more likely to know the target recepient.
64 of the letters arrived at the target, with the average path length between 5 and 6.
“I read somewhere that everybody on this planet is separated by only six other people. Six degrees of separation between us and everyone else on this planet.” (from a play by John Guare)Copy
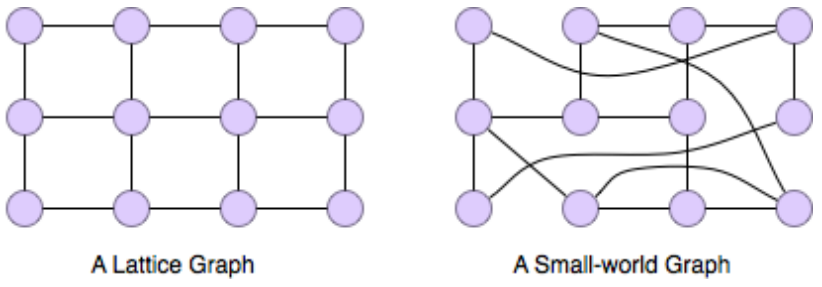
Image Source: Social Network Analysis for Startups, Tsvetovat and Kouznetsov, R’Reilly 2011
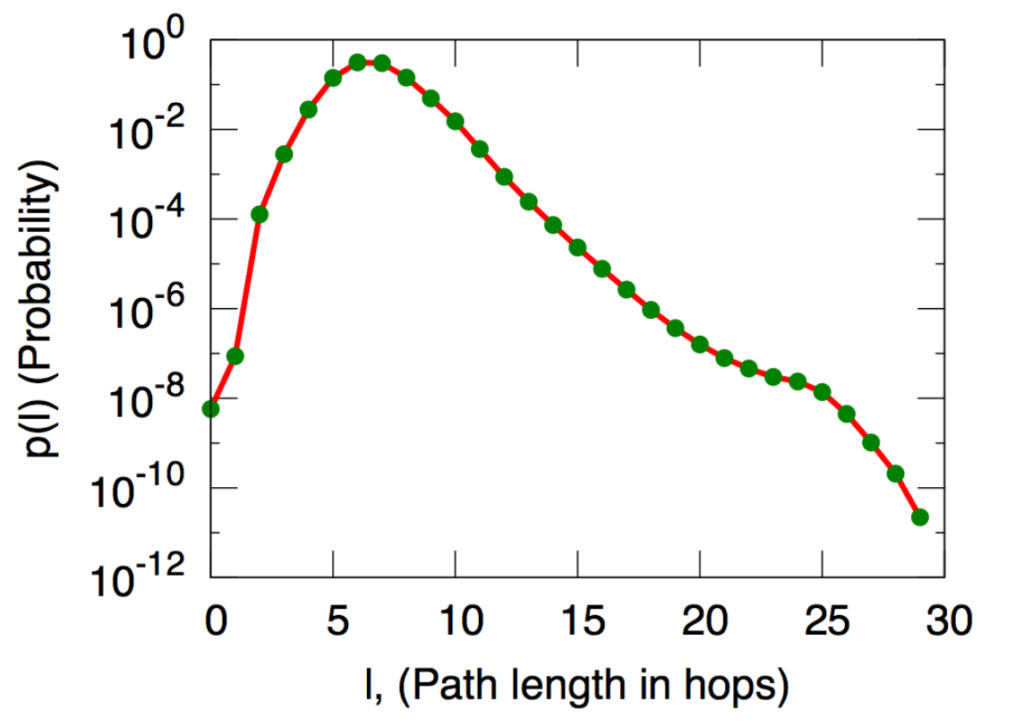
The distribution of distances (more precisely, the average distance to 1000 randomly chosen users) in the network of Microsoft Instant Messager users. An edge in this network means the two users communicated at least once in the one month experiment period. The x axis represents distance and the y axis is the frequency (probability) of that distance among pairs of nodes.
Source: Jure Leskovec and Eric Horvitz, Worldwide buzz: Planetary-scale views on an instant-messaging network. In Proc. 17th International World Wide Web Conference, 2008.
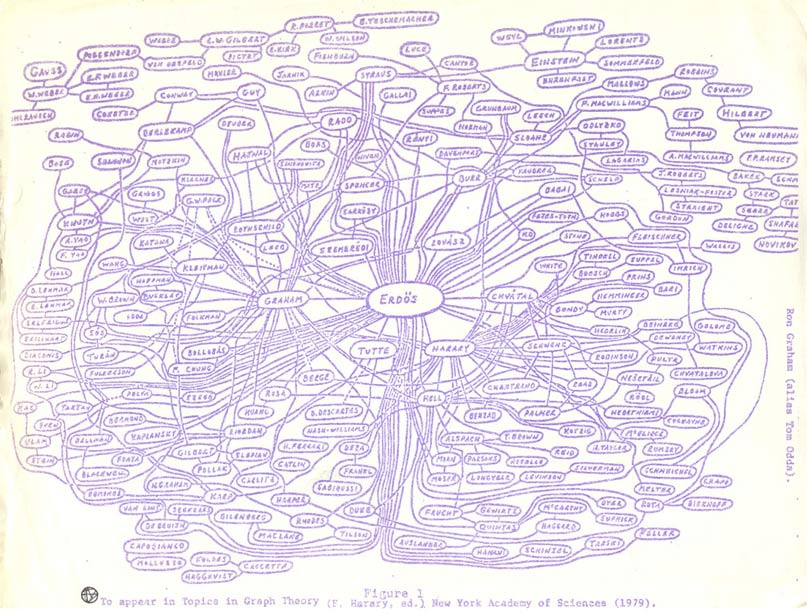
Collaboration network of mathematicians centered around Paul Erdos. Hand-drawn by Ronald Graham.
https://sites.google.com/oakland.edu/grossman/home/the-erdoes-number-project
The Watts-Strogatz model for small world networks
Watts-Strogatz model is a model which generated random graphs with small world property. We start with a regular (i.e. all nodes have the same degree) graph in which each node is connected to the nodes near it on the ring. This somehow represents a geographical graph. Then with the probability , each edge is changed into where is chosen uniformly at random and . As nears 1, the graph converges into a random graph.
You can experiment with this model here.

Image source: Watts, D. J. & Strogatz, S. H. (1998). Collective dynamics of ‘small-world’ networks. Nature 393: 409–10.
Homophily
Homophily: we tend to be similar to our friends. Homophily is a basic phenomenon that affects the structure of social networks.
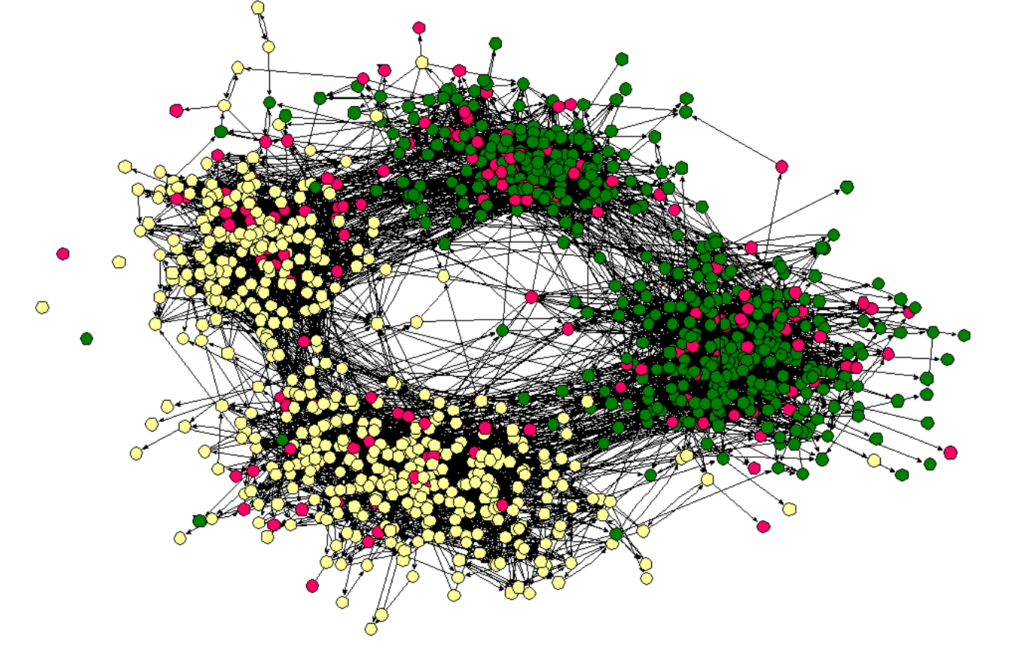
The friendship network in a high school and middle school in America. Node color represents race.
Source: James Moody. Race, school integration, and friendship segregation in America, 2001.
Measuring homophily: Imaging we have two groups of nodes in our network, say male and female. If the probability of being male is and the probability of being female is then if there is no homophily, the probability of existence of a link between a male and a female would be . If the fraction of cross-group edges is significantly less than this (as determined by statistical tests), then we have homophily in the network.
Mechanisms behind homophily:
Selection: A person’s immutable characteristics (race, IQ, age,…) affect the connections and choices they make.
Influence: Those to whom we are connected affect our choices. Also called peer pressure.
The effect of selection is comparable to, or greater than the effect of social influence.
- Denise B. Kandel. Homophily, selection, and socialization in adolescent friendships. American Journal of Sociology, 84(2):427–436, September 1978
- Jere M. Cohen. Sources of peer group homogeneity. Sociology in Education, 50:227–241, October 1977
Other topics:
Affiliation and link formation
Snowball sampling in social networks