Comparing U.S. Presidents’ First Years
In part two of this project, I created a model for sentiment analysis with tensorflow. I used this model to perform sentiment analysis on news article abstracts from the past four U.S. presidents’ first years in office. I also include the ten most commonly used words each month, for each president/month combo. In part one, I include presidential approval ratings from Gallup * to see how news sentiment correlates with public approval.
Forecasting with Trees: Hybrid Modeling for Time Series
Tree-based algorithms are well-known in the machine learning ecosystem. By far, they are famous to dominate the approach of every tabular supervised task. Given a tabular set of features and a target to predict, they can achieve satisfactory results without so much effort or particular preprocessing. The weak spot of tree-based models is that they can’t extrapolate on higher/lower feature values than seen in training data.
7 Steps to Mastering Machine Learning with Python in 2022
Are you trying to teach yourself machine learning from scratch, but aren’t sure where to start? I will attempt to condense all the resources I’ve used over the years into 7 steps that you can follow. You need to have a working knowledge of programming before you dive into machine learning. Most data scientists use either Python or R to build ML models.
Using POTATO for interpretable information extraction
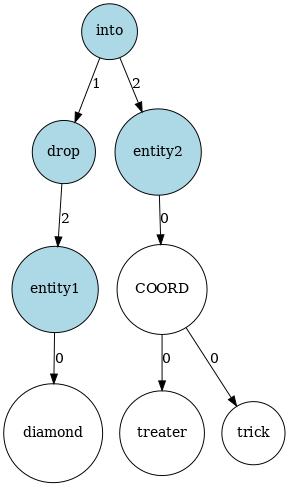
POTATO tries to solve some of the drawbacks of rule-based models by combining machine learning and rule-systems. Instead of writing rules on tokens of text, we can write rules on graphs that could utilieze the underlying graph structure of texts. In the networkx python package we provide a unified interface for graph representation and the users can write graph patterns on arbitrary graphs.
A Big Problem with Linear Regression and How to Solve It
The idea behind classic linear regression is simple: draw a “best-fit” line across the data points that minimizes the mean squared errors. Looks good. But we don’t always get such clean, well behaved data in real life. Instead, we may get something like…
4-Step Routine to Assess Your Model Performance
How can we say “this model generalizes well”, “that algorithm performs well”, or simply “that’s a good one”? In this article, we are looking at the methods and metrics widely used in machine learning to analyze the performance of classification models.
Advice & Tips for Passing AWS Machine Learning Specialty
In the second half of 2021 (aka. day 673 of the year 2020), I took and passed the AWS Certified Machine Learning Specialty exam. At the point of the exam, the extent of my experience with cloud computing consisted of having trained and set up a deployment of XGBoost on the cloud. I started studying in earnest after Labor Day weekend to give myself a full 6 weeks to prepare.
Random Forests Walkthrough — Why are they Better than Decision Trees?
Random Forests are always referred as a more powerful and stable version of “tree-based” models. In this post we will prove why applying wisdom of the crowds to Decision Trees is a good idea.
Naive Bayes Python Implementation and Understanding
Naive Bayes is a Machine Learning Classifier that is based on the Bayes Theoram of conditional probability. We will be understanding the mathematics behind this classifier and then coding it in Python. The formula for calculating conditional probability is shown below. It allows us to calculate the probability of a particular event GIVEN a set of prior conditions. For example, the probability that it will rain tomorrow GIVESEN that it rained yesterday.
What You Love to Ignore in Your Data Science Projects
In this story, we’ll get right to the point. There is a lot to cover about this subject; thus, we’ll split it into…
An Overview of Logistic Regression
Logistic regression is a widely-used algorithm in many industries and machine learning applications. It is an extension of linear regression to solve classification problems. We will see how a simple logistic regression problem is solved using optimization based on gradient descent, which is one of the most popular optimization methods. It works on assumption of independent linearity and requires that the independent variables linearly related to the log odds.
Principal Component Analysis (PCA) Explained Visually with Zero Math
Principal Component Analysis (PCA) is an indispensable tool for visualization and dimensionality reduction for data science but is often buried in complicated math. It was tough-, to say the least, to wrap my head around the whys and that made it hard to appreciate the full spectrum of its beauty.
While numbers are important to prove the validity of a concept, I believe it’s equally important to share the narrative behind the numbers — with a story.
Data Warehousing with Snowflake for Beginners
Snowflake is software as a service cloud-based data warehousing on AWS. It is the first database of analytics to be developed entirely in the cloud. It’s compatible with cloud systems like Google, Azure, and AWS. Snowpipe will be used to automate data loading in bulk. Externally sourced data can be bulk loaded using third-party applications. We’ll concentrate on data loading from CSV files in this section.
Getting Started with PyTorch Image Models (timm): a practitioner’s guide
PyTorch Image Models (timm) is a library for state-of-the-art image classification, containing a collection of image models, optimizers, schedulers, augmentations and much more. The purpose of this guide is to explore timm from a practitioner’s point of view, focusing on how to use some of the features and components included in timm in custom training scripts.


